Overview
CellView Software with Graphing
for CellMite® and CellMite® LVDT Signal Conditioners
The Cellview Graphical User Interface is designed to communicate with a precision CellMite® or CellMite LVDT® digitizing signal conditioner that is, itself, designed to amplify, filter, and linearize the output of either a strain gauge sensor or an AC LVDT sensor. CellView presents the user with a graphical user interface designed to monitor incoming data from the CellMite® and to visualize and refine the data in a way that is useful to the user.
Features:
- User interface connects to either a CellMite® or a CellMite LVDT®.
- User interface guides user through adding and removing CellMites®.
- CellMites® can hold calibration data for up to three separate sensors.
- Sensors may be load cells, extensometers, pressure sensors, LVDT sensors (if the attached unit is a CellMite® LVDT), or torque sensors.
- User interface guides user through sensor calibrations including MilliVolt per Volt, 2 Point Mass, 6 Point Mass and Shunt Calibrations.
- User interface allows user to name CellMites®.
- User can tare and reset peak and valley for the sensor.
- User can save and load CellMite® setup and sensor/graph setup information.
- Real-Time graph displays incoming test data.
- User has the option of setting up a test to start and/or stop automatically.
- LEDs inform user of the operational status of CellView.
- Graph parameters are editable by user.
- Graph can be zoomed and panned.
- Graph Cursor allows user to get accurate data for a single data point.
- User can refine data as it comes into the CellMite® by applying a 5th order polynomial to the data and creating a name for the resulting new unit of measure.
- User may export data and/or test information to MS Excel and other spreadsheet programs.
- User may save and print reports of tests with user-entered comments.
- User may load older tests for viewing and printing.
- User can control output using two relay switches set in the main panel as well as analog output of voltage.
- User can select the data sampling rate from among four options: 1 Hz, 5 Hz, 20 Hz, and 60 Hz.
CellView with Graphing - Real-Time Graphs!
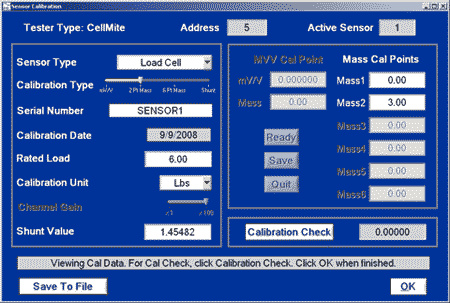
Sensor Calibration:
CellMites® can internally store up to three sensors' worth of calibration data. When the user selects the active sensor, the CellMite® uses that sensor's calibration data to translate the incoming signal from the sensor into load, extension, pressure or torque data.
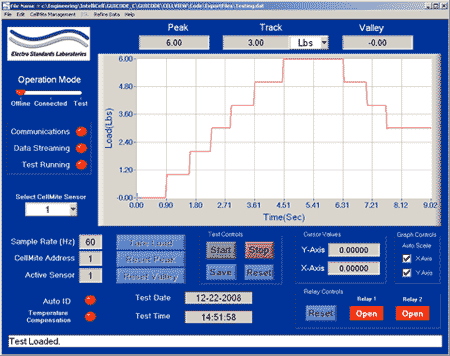
Main Panel:
The graph can be zoomed and panned to show the data the way the user wants it. Then the user can export and save the data, print the main panel, or view and print a report of the test.
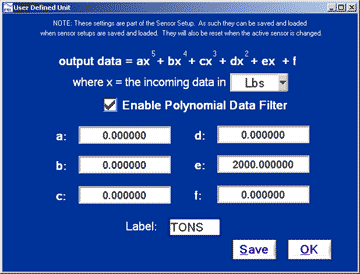
User Refined Data:
Cellview allows the user to apply a conversion factor to incoming data, so that the user can create their own unit of measure with which to run a test. The conversion factor is in the form of a polynomial equation that the user can manipulate by entering various values.
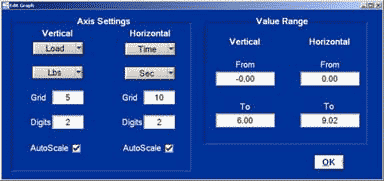
Edit Graph:
The graph parameters may be edited by using the Edit Graph panel selected from the menu. Auto scaling of axes is allowed from both the Edit Graph panel AND the Main panel.
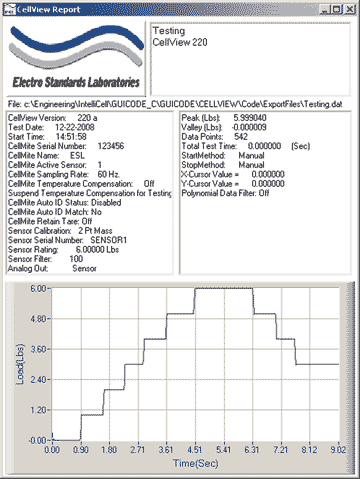
Test Report:
The report will appear with all currently visible test data graphed and all header information and comments in their places.
| System Requirements |
| |
Recommended |
| Processor |
Pentium 1V 1GHz |
| Memory |
1G |
| Disk Space |
100 MB |
| Video |
SVGA |
| Screen Resolution |
1024 x 768 Large Fonts |
| Windows Version |
Windows XP Pro |
| Drive |
CD-ROM |
| Printer |
Windows Compatible |
This product was also featured on ThomasNet.
All data switches, data communication products, and data acquisition products are subject to a one year warranty against manufacturing defects. The limit of ESL liability is limited to the cost of the ESL product provided.
*Prices online are subject to change and verification.
All ESL products are available for export.